September 9, 2021

Data show that Dot and Mattapan remain the city's 'cradle of youth'
Dorchester remains Boston’s largest neighborhood after adding nearly 8,000 new residents in the last ten years, the most in the city’s neighborhoods, according to an analysis from Boston planning officials based on US Census data.
Mattapan saw a smaller increase, about a thousand people, while losing some of its Black population, the data show.
The city’s overall population continued its upward trend, increasing to 675,647, which is still well below the high point of just over 800,000 in 1950. Its lowest point in recent history was a count of 563,000 in 1980.
Citywide, the population grew by 9.4 percent, while Massachusetts paced the nation by posting a 7.4 percent gain between 2010 and 2020. The Massachusetts population stands at just over 7 million.
The counting of residents across the country occurs every ten years, and the results determine the number of federal lawmakers who will represent them at the State House and City Hall as political boundaries are redrawn in the coming months, ahead of the 2022 election cycle.
The state’s elections chief, Secretary of State Bill Galvin, has indicated that the population increase will lead to a new seat in the Legislature for Boston, a task for the lawmakers to undertake.
The census numbers also help drive federal funding to the Bay State, with $16 billion pouring into accounts for health care, education, food and nutrition programs, housing, and childcare for low-income families.
The counting came during a pandemic, which caused Boston-area colleges and universities to send their sizeable student populations home. Separately, the Trump administration weighed in as its officials sought to undermine the count by adding a citizenship question, an attempt blocked by the US Supreme Court. Federal officials did change the wording of the Census to encourage people to pick multiple races, if applicable.
Additional census data, with a deeper look at demographics, are expected to be released in 2022.
When it comes to Dorchester and Mattapan, the population numbers as interpreted by city planning officials, bear closer scrutiny.
Ten years ago, city planners analyzed census numbers and found Dorchester to have a population of 91,982, while Mattapan had 36,480. But the numbers were based on planners deciding to assign certain census tracts that are in Dorchester to Roxbury and Mattapan. A Reporter analysis found that Dorchester had more than 134,000 people living within the original boundaries of the town of Dorchester, before it was annexed by Boston.
After the Reporter’s analysis, city planning officials reworked the numbers and decided that Dorchester’s population stood at 114,249 people, while Mattapan was at 22,494 residents. Officials with the Boston Planning and Development Agency (BPDA) contend they are still constrained by how census tracts, driven by federal guidelines, interact with neighborhood boundaries.
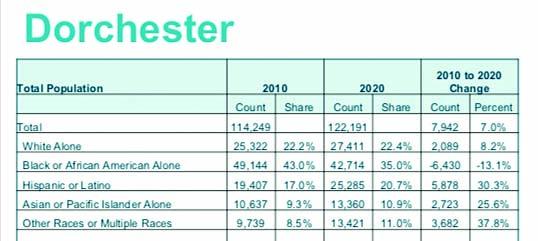
With those caveats, city planners say Dorchester’s population now stands at 122,191, an increase of 7 percent since 2010, or roughly 8,000 people.
The biggest increases came in the number of people who identified as Asian or Pacific Islander (2,723) and Hispanic or Latino (5,878). The number of people who identified with multiple or other races rose by 3,682. The number of white residents rose by 2,089 people, while the number of Black or African American residents fell by 6,430.
Broken out into percentages, Dorchester’s Hispanic population grew to 20.7 percent, up from 17 percent in 2010. The Black and African American population fell to 35 percent, from 43 percent. The white population grew to 11 percent, up from 8.5.
Mattapan’s population saw a smaller increase at 1,340 people, or 6 percent. The 2020 count stood at 23,834 for the neighborhood. The number of Black or African American residents dropped by 902, but non-Hispanic Blacks and African Americans still make up 68 percent of the population.
White residents rose by 60 people, Hispanic or Latino residents increased by 1,357, and Asian or Pacific Islander people rose by 104. People who identified as other races or multiple races increased by 721.
Dorchester and Mattapan appeared to be reflective of Boston as a whole. The city also added Hispanic and Asian residents at a heavy clip, while losing non-Hispanic Blacks and African Americans. Dorchester added the most number of Hispanic and Asian residents, according to the BPDA’s analysis.


