May 15, 2019

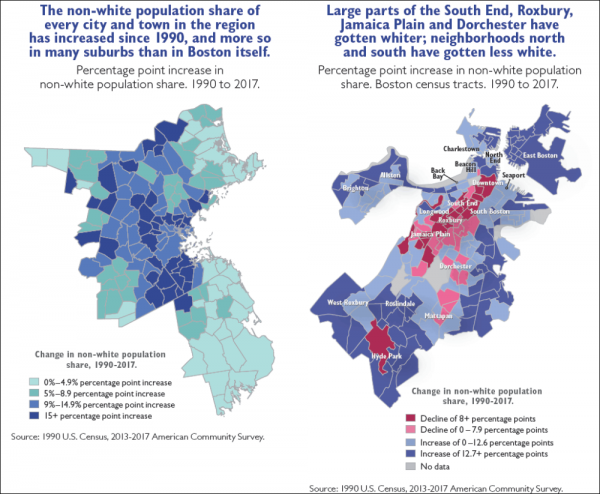
While every one of the 147 cities and towns that make up Greater Boston has seen a spike in residents of color over the last generation, a new report uncovered certain population shifts within Boston neighborhoods that likely mirror the routes that gentrification has taken.
The report, “The Changing Faces of Greater Boston,” examined demographic change in Massachusetts from 1990 to 2017. Its authors, a team composed of researchers from the Boston Foundation and the University of Massachusetts, analyzed data from US Census outlays and the American Community Survey and filled in local character through interviews in villages like Fields Corner in Dorchester.
With respect to Boston, the report found the minority-majority city was 44 percent white in 2017, down from 59 percent white in 1990.
African Americans make up 23.1 percent of the city while Latinos have jumped from roughly 11 percent to 20 percent over the past two decades. Asian Americans rose from 5.2 percent to 9.4 percent in that same time frame while Native Americans remained at about 0.2 percent of the city’s population.
“A cluster of core neighborhoods extending from Downtown through the South End and into Mission Hill and Jamaica Plain have seen a decline in people of color,” the report notes. “This very likely is a result of an influx of young white professionals that parallels the gentrification and displacement of communities of color.”
Some census tracts along that route have seen non-white populations drop by upwards of 10 percent. The Roxbury area just southeast of Northeastern University and Wentworth Institute of Technology lost 32.1 percentage points in non-white residents in 2017.
As of two years ago, that swing, for the most part, had not made significant inroads into Dorchester. Population estimates for most of Dorchester and Mattapan show all but four census tracts were still majority non-white in 2017, with several tracts abutting Franklin Park’s eastern edge more than 95 percent non-white and mostly black and Hispanic.
These were the tracts that showed the smallest gains or slight decreases in non-white residents over the 28-year period with a rise and fall of less than 2 percent, according to the report.
Along the Red Line corridor from JFK/UMass through to Ashmont and down the Mattapan Trolley route, almost every tract showed gains in non-white residents by upwards of 12.7 percent, rising as high as 46.5 percent in the census tract centered off Freeport Street and bounded by Clam Point and Fields Corner.
The area of Neponset around Gallivan Boulevard comprised only 10 percent non-white residents in 2017, but even that 4,000 or so resident tract was up about 6.8 percent in non-white populations from 1990, with small gains in the number of black, Asian, and Hispanic residents in an area that was once almost 97 percent white.

Two zones that have seen swings in racial makeup, or where residents feel on the cusp of displacement, are highlighted in the report. One is the city of Quincy and the other is Fields Corner.
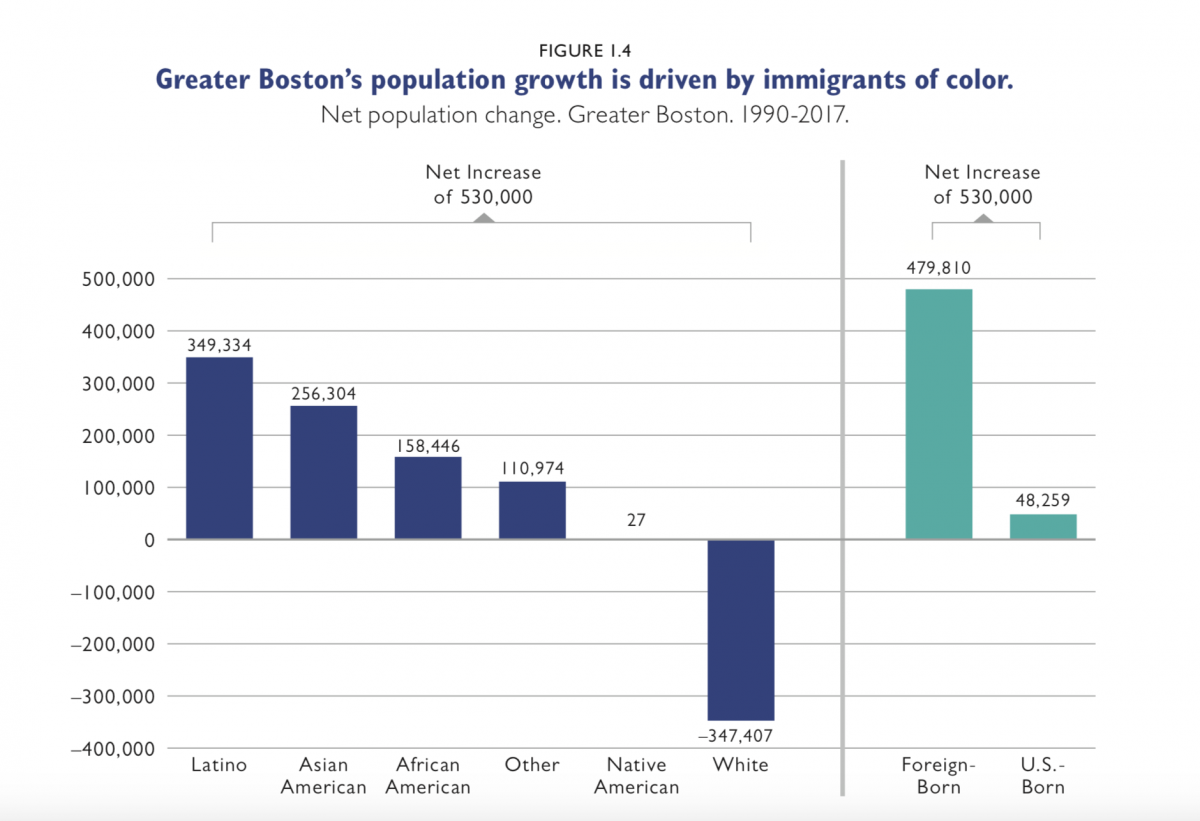
More than 90 percent of the region’s net population growth since 1990 has come from new immigrants, the report shows. More than two-thirds of Asian Americans in Greater Boston were foreign-born as of 2017, and the black foreign-born share jumped from 21 to 38 percent since 1990.
Most of the Vietnamese residents of Fields Corner – their country of orgin accounts for about 75 percent of Dorchester’s Asian-American population – began arriving in 1975 as refugees of the Vietnam War. Their numbers grew slowly over the next decade, with many early arrivals struggling with language adjustment, low income levels, and a lack of social supports, the report notes.
Now Asian Americans and white residents make up roughly equal portions of the local population, about a third in the dominant Fields Corner census tracts where Vietnamese cultural institutions have become staples of the neighborhood.
“Essential to the integration process was an increase in self-advocacy and civic involvement on the part of Vietnamese Americans,” the report said. It highlights the founding of Vietnamese American Initiative for Development (VietAID) community development organization in 1994 as “a particularly important milestone for the Vietnamese community in Dorchester.”
That community still has disproportionately low income and educational attainment levels compared with the Greater Boston average, Boston Indicators notes. “English proficiency is also a challenge, particularly for Vietnamese American seniors in Boston of whom 85.1 percent spoke English “not well” or “not at all” as of 2015.
In this context, development pressures feel like an incursion on a cultural center, according to the report, which noted that “for many Vietnamese Americans, particularly new immigrants and the elderly who are less proficient in English, living in an ethnic enclave is more than just a comfort; it is crucial to accessing needed services.”
The Red Line corridor stretches through a still underdeveloped swatch of the neighborhood and the city is reviewing draft recommendations now for a planning area that stretches roughly between the Fields Corner and Savin Hill T stations along Dorchester Avenue. Home prices in the district where Fields Corner is located jumped by 76 percent in the last five years, while Boston as a whole saw a rise of 51 percent.
Larger projects like Dot Block and the planning study sparked the development of Dorchester Not For Sale, a diverse affordable housing and anti-gentrification group. Carolyn Chou, program director at the Asian American Resource Workshop, told the report’s authors that Dorchester residents are responding to increased housing pressures by decamping to areas like Quincy, Randolph, Brockton, and Weymouth.
“The Asian American community has grown and become well established in Dorchester alongside other racial groups,” the report said. “The future sustainability and well-being of this community, like that of other communities of color in Boston, however, remain uncertain.”
The full “Changing Faces of Greater Boston” report can be explored on the Boston Indicators website.


